A hierarchical count model that borrows strength from neighbouring precincts, each precinct's own history and what is known about the area, so a quiet precinct gets an honest estimate rather than a zero.
0.84
AUC on precincts that recorded no carjacking
9 of 12
Crime-years forecast better than last year's count
1,167
Police precincts
AUC: the chance that a zero precinct which went on to record a carjacking in 2025/26 was ranked above one that did not; a three-year average scores 0.70. Forecast comparisons use mean absolute error per precinct for 2023/24, 2024/25 and 2025/26, with 95% paired bootstrap intervals over precincts.
In brief
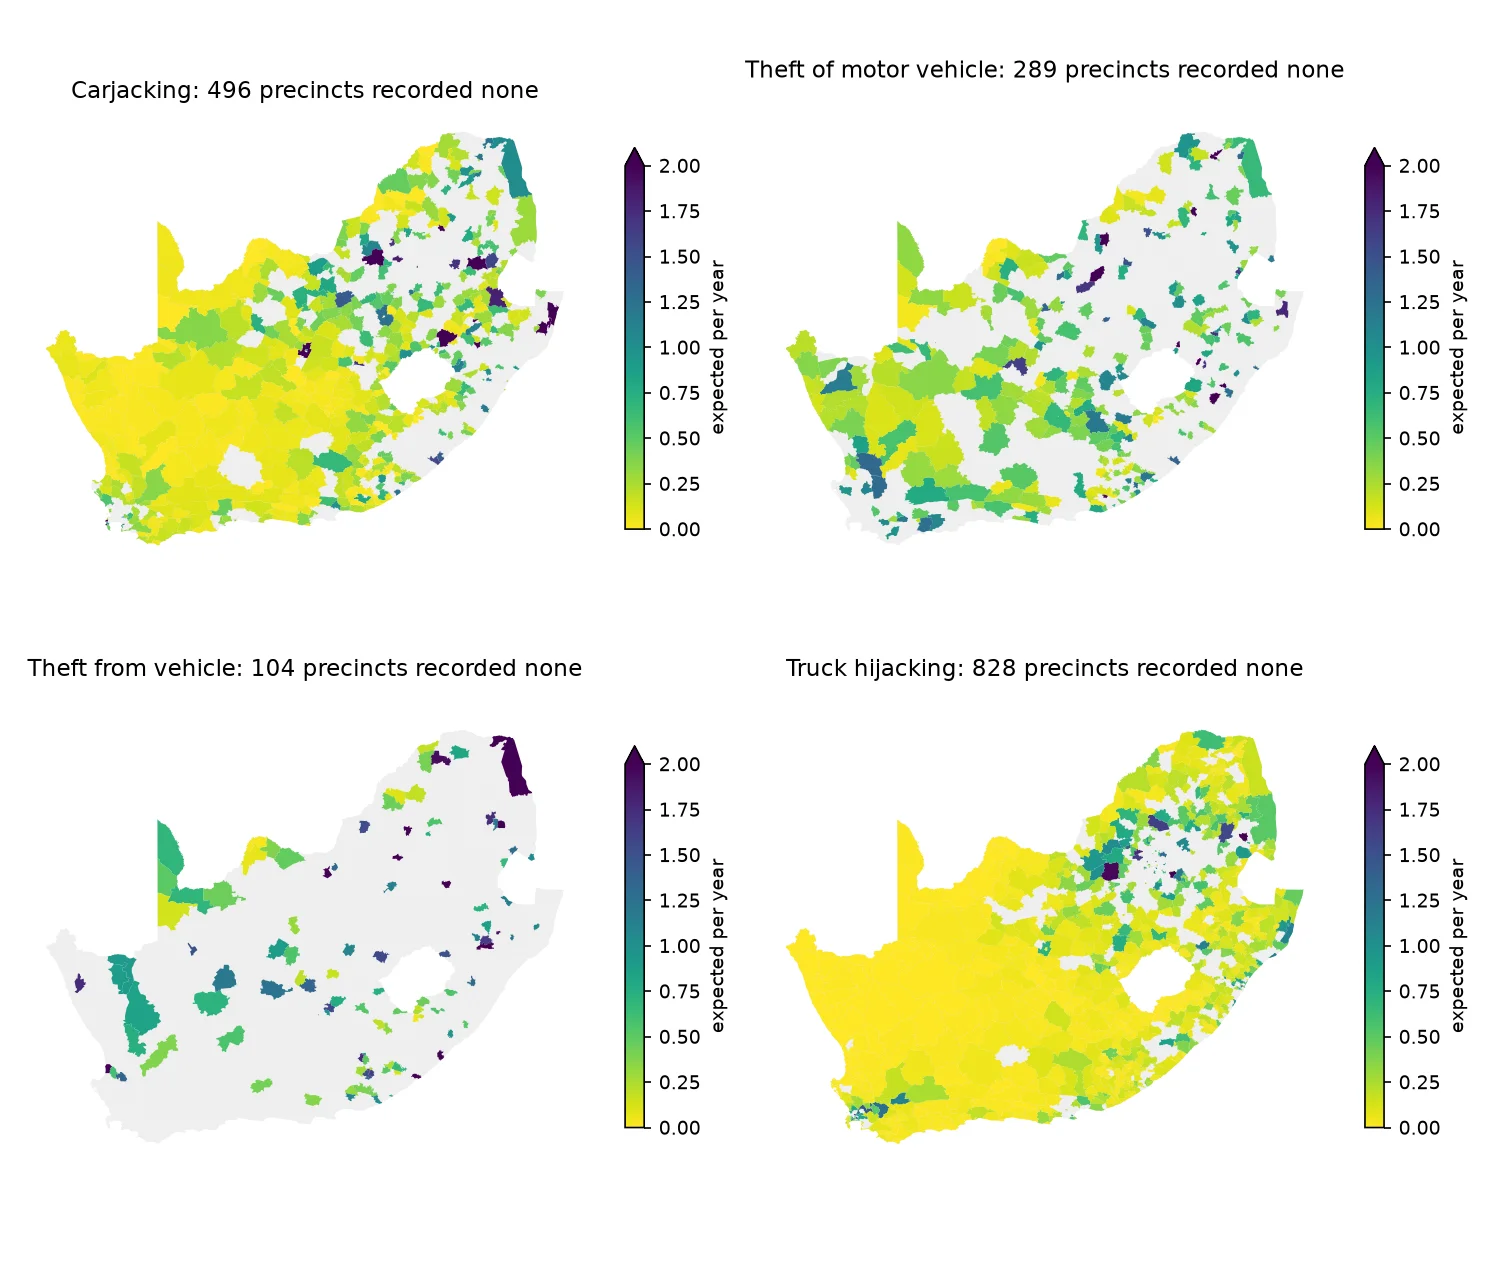
A precinct that recorded no carjackings last year has not shown that carjacking cannot happen there. This model gives each of South Africa's 1,167 police precincts an expected monthly count, with an interval, for carjacking, vehicle theft, theft from vehicles and truck hijacking, from SAPS counts for January 2020 to March 2026, Census 2022 and OpenStreetMap. Forecasting each of three years from the years before, it beat the rule that next year equals last year in 9 of 12 crime-years and was level in the other three. Among the 444 precincts with no carjacking in 2024/25, it ranked which would record one with an AUC of 0.84.
Problem
Police statistics give a count per precinct, and hundreds of precincts record no carjacking in a year. A zero is a low count, not proof that there is no risk, and a count of 3 against 5 says little on its own. A vehicle-tracking alert engine needs a prior risk that is fair to quiet precincts, carries its uncertainty, and can be looked up for a place and an hour.
What I built
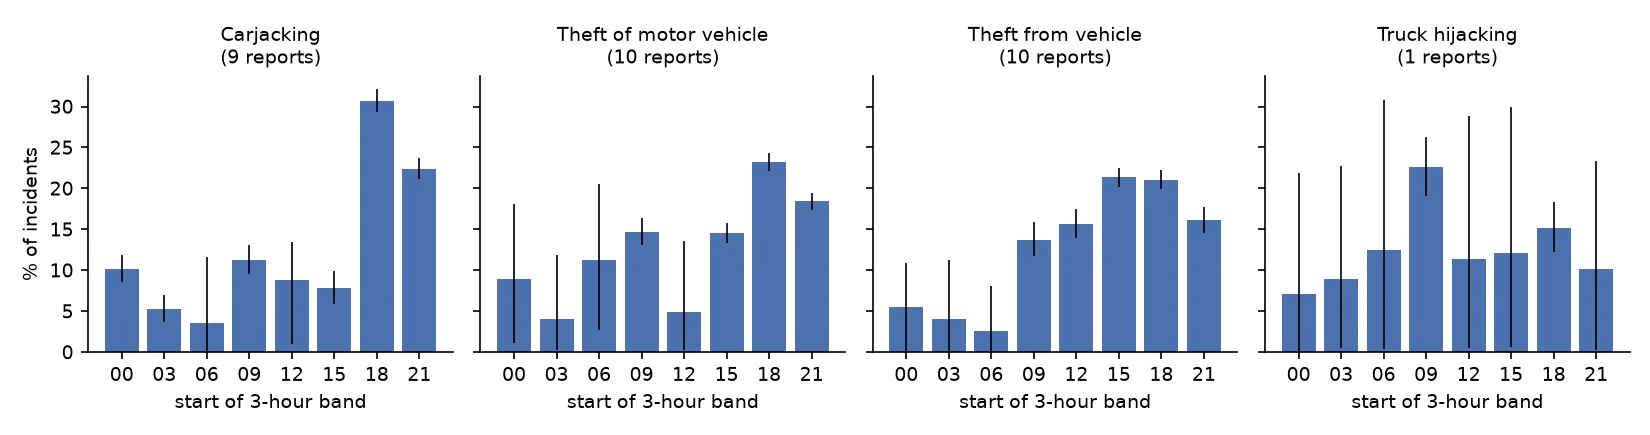
Monthly counts for 1,167 police stations from January 2020 to March 2026 (87,525 precinct-months per crime) come from SAPS releases. Each crime is fitted separately in R-INLA. Covariates come from OpenStreetMap (roads, fuel stations, shops, land use, border posts) and from Census 2022 tables by police district (household car ownership and dwelling type). Time-of-day and day-of-week profiles are rebuilt from the partial tables in SAPS annual crime reports, and the engine reads relative risk for a precinct, month, day and three-hour band from a lookup.
Method, step by step
- Negative binomial counts with a BYM2 spatial effect over neighbouring precincts, per-precinct slopes, national and provincial random walks and a cyclic calendar-month effect
- A national linear trend and a precinct-by-year AR(1) effect, adopted only after they won the forecast backtests
- Twelve stations that opened during the period: their shared months are set to missing, and the fill is checked against the combined count the older station recorded
- Hold-out test: all 75 months of a random 10% of precincts hidden and refitted, against national and neighbour per-resident rules
- Forecast backtests for three target years, each refitted on the months before, against last year's count, a three-year average and the model without its trend and year effects
- A Gibbs sampler combining 83 time-of-day and 149 day-of-week shares from SAPS reports that each give only some bands or days
- Relative risk by precinct, month, day and three-hour band, with intervals combined on the log scale and tests on the lookup
Results
- Forecasts: the model beat last year's count in 9 of 12 crime-years, with the interval of the difference below zero, and was level in the other three, all in 2023/24. For carjacking in 2025/26 the error per precinct was 4.25 against 5.03.
- Precincts that recorded nothing: for carjacking, vehicle theft and truck hijacking the model ranked which would go on to record a crime better than the three-year average in every year. For carjacking its AUC was 0.77 to 0.84 against 0.63 to 0.71. Of the 2025/26 zero precincts it ranked in the top quarter for carjacking, 40% recorded one; in the bottom quarter, 2%.
- Blind fill of hidden precincts: monthly 95% intervals covered 98 to 99% of months. For carjacking, copying the neighbours' rate per resident does about as well as the model, and across two hold-out draws neither is clearly better, because carjacking hotspots cluster tightly.
- Carjacking peaks from 18:00 to 21:00 (30.7% of incidents) and on Fridays and Saturdays. Truck hijacking is a weekday crime.
Research context
- The model predicts recorded crime. The Stats SA victim survey estimates 3 to 7 times more vehicle thefts and hijackings than SAPS records, so the comparison between precincts and hours is the reliable part, not the absolute level.
- The time-of-day and day-of-week profiles are national, come from reports for 2016 to 2020 and are assumed the same everywhere. The national forecast lags turns in the trend, missing by 10 to 17% in years when the direction changed.
- Built as the prior risk for a vehicle-tracking alert engine in development. Only public data is used here.
Tools and methods
Methods
- Bayesian hierarchical models
- Negative binomial regression
- BYM2 spatial effects
- Random walk and AR(1) time effects
- Hold-out and forecast backtests
- Paired bootstrap
- Gibbs sampling
Tools
- R
- R-INLA
- Python
- GeoPandas
- OpenStreetMap
- Census 2022