Statistics / Public procurement · 2026
TenderTrace
South Africa publishes its public tenders in the Open Contracting Data Standard, so in principle anyone can download them and ask how public money is spent. Before asking that, I asked how much there is to download and what is wrong with it. Checks run on faulty data report the faults as findings.
I collected 53,421 tenders from January 2021 to July 2026 from National Treasury's eTender portal and the Open Contracting Partnership's copy. Every response is kept exactly as it arrived, and five checks were fixed in writing before they were run.
Findings 6
- 1
The downloads hold about a third of the tenders the portal lists.
Each month's file says how many tenders it should hold, but it contains only the last 1,000 rows, and the files start in January 2024. The API returns an error for any page containing an awarded tender, so the only way through is one record at a time, about five seconds each. With the Open Contracting copy filling gaps, between 9% and 44% of each month is there. Awards are the most under-counted.
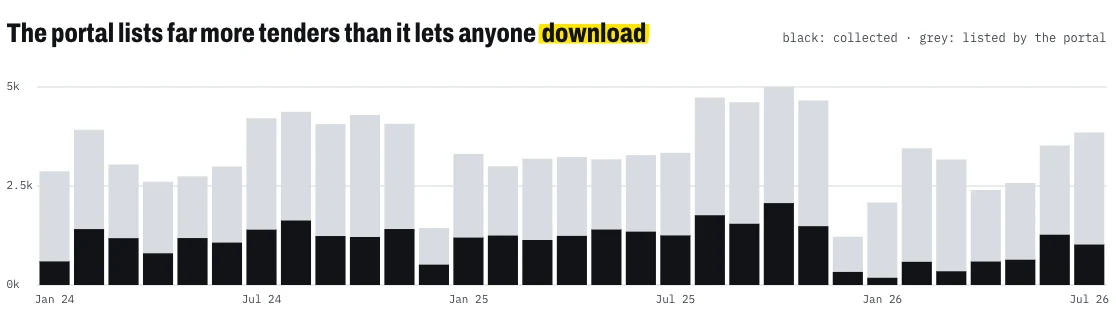
Tenders the portal lists each month (grey) against those that could be collected (black). ≈ 1/3of listed tenders, 2024 to July 2026
- 2
Every published tender value is R0.
All 53,421 tenders have an expected value of R0. Of 1,319 awards that can be matched to their contract, 508 are about a hundred times the contract, which looks like amounts captured in cents. So no check here uses a rand amount.
R0every tender's published value
- 3
640 tenders have short windows, and 12 buyer-years have more than expected.
A tender open for only a few days favours bidders who already knew it was coming. Against tenders run the same way that year, 640 are short. Where the method is unknown, comparing by kind of purchase flags 2,024.
Twelve of the 197 buyer-years that could be scored run more short tenders than their mix of methods predicts. Some of those flags are data, not behaviour: all seven of SANRAL's short tenders in 2024 open and close on the same date.
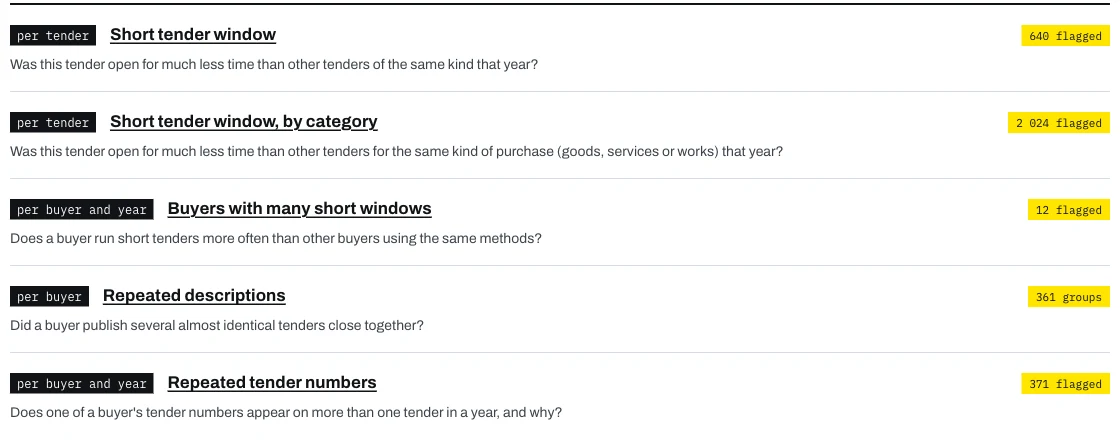
The five checks and their counts on the public page. 640tenders open under seven days and shorter than 95% of their peers
- 4
The first buyer check mostly measured the use of quotations.
The first version compared buyers buying the same kind of thing and flagged 37 buyer-years. Of the 755 tenders behind those flags, only 3 were open tenders. The rest were quotations and deviations, which are short by design, or had no method recorded at all.
It was replaced by a comparison within the same method, and the old result is kept beside the new one.
3 of 755tenders behind its flags that were open tenders
- 5
Merging the two sources had dropped the procurement method.
For 5,694 tenders held in both sources, the database had kept the later portal copy, which drops the procurement method the earlier copy carried. I restored the method from the earlier copy and checked that nothing else changed. That raised the share of recent tenders with a known method from 31% to 48%.
31% → 48%recent tenders with a known method
- 6
Most repeated tender numbers are duplicate postings.
Of 577 tender numbers used more than once in a buyer's year, 371 are flagged. Most are one tender posted twice on the same day with a word-for-word description.
That matters for another check. Groups of near-identical adverts from one buyer are what contract splitting looks like, and 54 of the 361 such groups exist only because of these duplicates.
371 of 577repeated tender numbers flagged
Method
- Every download kept
- Each response is stored exactly as it arrived, under its hash, so any figure can be traced back to its source.
- Checks fixed first
- Each check's threshold was written in a dated document before the check first ran, so none could be tuned to catch a particular buyer. A fix is rerun once as a new version, with the earlier result kept.
- Like against like
- Short windows are compared with tenders of the same method and year. Each buyer is compared with the count expected from its own mix of methods, using a Poisson-binomial test with false discovery control.
- From a flag to a case
- For any buyer and year there is an Excel audit file. Each test is a visible formula, the sample can be drawn again, and the preparer and reviewer sign off separately. On ESKOM's 2022 tenders, all 6,391 formulas agreed with Excel's own calculation. Escalations go into a local case log, chained so a later edit shows, which is never published.
Limitations
- Every count covers only the tenders that could be collected. That share is partial and not random, so a buyer's count says as much about coverage as about the buyer.
- Half of recent tenders still have no method. Their buyers are unscored, not cleared.
- With 30 to 60 tenders, one or two windows can move a buyer in or out of the list. Eight of the twelve flagged buyer-years are that small.
- A flag marks a pattern worth reading by hand. It is never a finding of wrongdoing, and no supplier is named.
The dashboard
Data shows what can be downloaded and what is wrong with it. Explore searches the tenders by year, method and flag, Buyers compares each buyer with its peers, and Checks lists the five checks and what each flagged. A flag is a pattern worth reading, never a finding.